Horaizon Orthopedic Implants
Comparing orthopedic implant brands in 2026 requires more than reading a polished brochure. An implant may look identical to another on a product page. Its performance depends on materials, design, manufacturing controls, and clinical use. How to compare the quality of orthopedic implants from different manufacturers is therefore a practical question, not a simple ranking exercise.
Experienced orthopedic teams examine titanium or cobalt-chromium specifications, surface treatments, fixation methods, and wear characteristics. They also review peer-reviewed studies, registry data, regulatory clearances, and documented quality systems. Traceability matters. Each component should connect clearly to a verified production batch, inspection record, and sterilization process. A surgeon may also assess how the implant feels during preparation, especially when instruments fit poorly or surgical steps become unclear.
Small details can reveal larger weaknesses. Inconsistent packaging, vague instructions, or delayed technical support may create avoidable risks. However, no single brand is ideal for every patient or procedure. Evidence can be limited for newer designs, even when their laboratory results appear impressive. That limitation deserves honest attention. Marketing language can also sound more certain than the research supports.
A reliable comparison combines clinical experience with independent evidence and careful supplier review. Hospitals should evaluate revision rates, complication reporting, training quality, and long-term follow-up. Cost matters, but a lower purchase price may not reflect total value. Instrument durability, inventory reliability, and patient outcomes also influence the decision. The strongest choice is usually the one supported by transparent data, consistent manufacturing, and responsible clinical judgment.
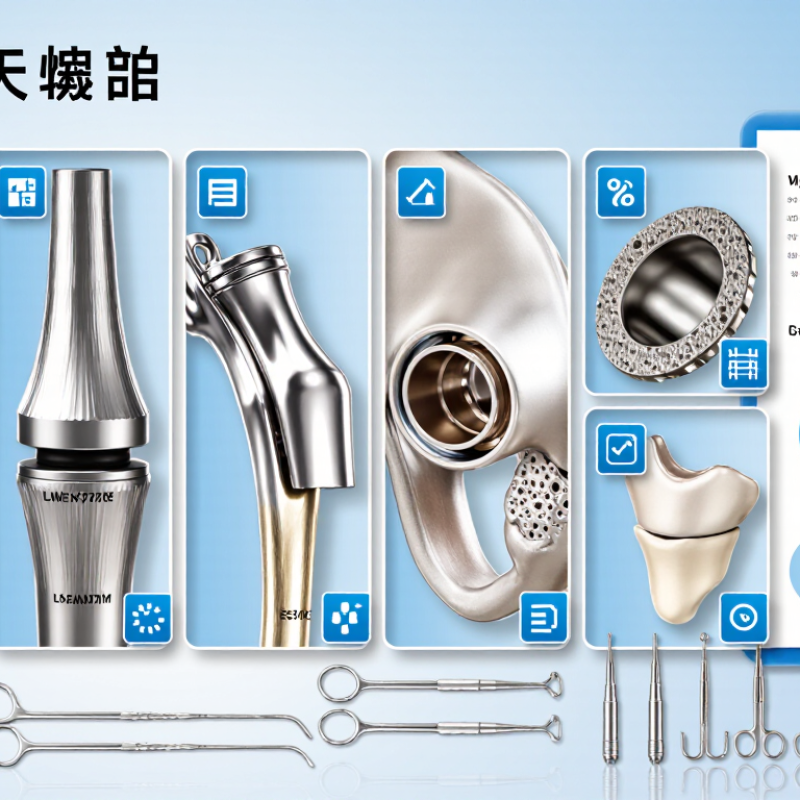
Orthopedic implant quality means more than a polished surface or a low complication rate. It reflects material safety, design accuracy, manufacturing control, and clinical performance. In practice, surgeons and hospitals should review fatigue strength, wear resistance, corrosion behavior, and fixation stability. These factors influence how an implant performs under repeated walking, lifting, and turning.
Evidence matters. Examine peer-reviewed studies, registry data, revision rates, and follow-up periods longer than one year. Short studies can look impressive, yet they may miss loosening or wear that appears later. Manufacturing quality also deserves close attention. Traceability, sterilization controls, dimensional inspection, and documented quality systems reduce avoidable variation. Still, no evaluation method is perfect. Patient anatomy, surgical technique, activity level, and rehabilitation can change outcomes. I have seen technically strong designs perform differently when clinical conditions vary.
Tips: Compare equivalent implant types, not marketing claims. Ask for test methods and sample sizes. Check whether evidence applies to the intended patient group. Review how failures were defined. A low revision rate may hide incomplete follow-up. Also, discuss handling, instruments, and training with experienced surgical teams. Small details matter, sometimes more than expected. Quality should be judged through consistent evidence, practical usability, and transparent reporting rather than appearance alone.
How to Compare Orthopedic Implant Quality Across Brands in 2026?
Material selection is the first practical checkpoint. Titanium alloys can reduce weight, while cobalt-chromium alloys provide strong wear resistance. Ceramic surfaces may reduce debris, but they can increase sensitivity to manufacturing defects. Polyethylene quality depends on crosslinking, oxidation control, and sterilization. Ask for material certificates, not attractive brochures. ASTM specifications and ISO 10993 biocompatibility testing should support every patient-contacting material.
Design quality appears in details surgeons can assess. Look for porous surfaces that encourage bone ingrowth, stable locking mechanisms, and instrumentation that limits surgical variability. Geometry must match anatomy, not merely look innovative. The American Joint Replacement Registry’s 2024 Annual Report analyzed more than 3 million hip and knee procedures, showing why long-term revision tracking matters. A five-year result is useful. Ten-year survivorship is stronger evidence. However, registries cannot remove differences in patient age, activity, diagnosis, or surgical technique.
Manufacturing standards deserve equal attention. ISO 13485 quality systems, validated cleaning, controlled heat treatment, and lot-level traceability should be documented. The U.S. FDA’s 2023 Medical Device Reports database recorded more than one million device reports across all device categories, reminding readers that surveillance data need careful interpretation. Report volume does not automatically prove poor quality. I would also compare dimensional inspection, fatigue testing, and packaging validation. No scorecard is perfect. My own assessment can still miss problems hidden by limited follow-up, incomplete registry participation, or changing production sites.
Comparing orthopedic implants requires more than a polished brochure or a low purchase price. Start with clinical evidence from peer-reviewed trials, national joint registries, and independent follow-up studies. Look for comparable patients, surgical techniques, and follow-up periods. A five-year result cannot fairly compete with a ten-year result. Check whether outcomes include revision surgery, infection, loosening, fracture, pain, mobility, and patient-reported function. Evidence varies.
Safety records need their own review. Search regulator notices, published adverse-event reports, and implant-specific recall histories. Separate a manufacturing issue from a design pattern. Ask how often problems occurred, how severe they were, and whether corrective action worked. Hospital quality teams can examine lot tracking, sterilization documentation, and complaint trends. A clean public record is reassuring, but it does not prove zero risk. Reporting practices differ between countries and hospitals. That limitation matters.
Long-term performance is visible in revision rates, imaging changes, activity levels, and patient comfort years after surgery. Compare like with like: age, bone quality, diagnosis, fixation method, and surgeon experience can change results. Independent registries are especially useful when they report patient numbers and confidence intervals. Ask whether follow-up includes patients who changed hospitals or stopped responding. Missing data can make durability appear better than it is. I would also question unusually perfect numbers. Real-world care is rarely perfect.
Brand-neutral comparison framework using commonly reported clinical, registry, safety, and survivorship measures. Benchmark ranges are not universal pass/fail thresholds and should be adjusted for implant type, patient risk, surgical technique, and follow-up duration.
| Evaluation Dimension | Key Data Point | Evidence-Based Reference Range or Signal | What Strong Evidence Looks Like | How to Interpret the Result |
|---|---|---|---|---|
| Clinical Evidence | Prospective clinical follow-up | At least 2 years for early safety; 5–10 years for meaningful durability assessment | Peer-reviewed prospective studies with a clearly defined cohort, patient-reported outcomes, revision tracking, and low loss to follow-up | Longer independent follow-up is more informative than short-term promotional claims |
| Clinical Evidence | Study design quality | Randomized trials and well-adjusted comparative cohorts provide stronger evidence than single-arm case series | Prespecified endpoints, transparent inclusion criteria, adjusted confounders, and a registered protocol | A large sample alone does not eliminate bias if the comparison group or follow-up is weak |
| Clinical Outcomes | Patient-reported outcome measures | Harris Hip Score, Oxford Hip Score, Oxford Knee Score, KOOS, and PROMIS are commonly used validated measures | Reports baseline scores, clinically meaningful improvement, responder rate, and missing-data handling | Statistical improvement should be checked against clinically meaningful improvement, not p-values alone |
| Long-Term Performance | Ten-year revision or failure risk | For many contemporary hip and knee replacements, registry-reported 10-year revision risk commonly falls in the mid-single digits, but varies substantially by procedure and patient group | Kaplan–Meier or competing-risk estimates with confidence intervals and a clearly stated revision definition | Compare like with like: joint, fixation method, age, sex, diagnosis, and follow-up must be aligned |
| Long-Term Performance | Revision-free survival at 15–20 years | Useful for established implant designs with sufficient historical follow-up; results are not appropriate for recently introduced products | Independent registry or cohort data with adequate numbers remaining at risk beyond 15 years | A lack of long-term data should be reported as uncertainty, not automatically as poor quality |
| Safety Records | Deep infection or periprosthetic joint infection | Primary large-joint arthroplasty infection rates are commonly reported around 1%–2%, depending on case mix and surveillance method | Explicit numerator, denominator, surveillance period, infection definition, and risk adjustment | Small differences require large cohorts because infection is relatively uncommon |
| Safety Records | Early adverse events | Assess dislocation, periprosthetic fracture, thromboembolism, nerve injury, readmission, and reoperation within 30 and 90 days | National registry linkage or independent claims validation with standardized event definitions | Early safety should be compared separately from mechanical durability |
| Safety Records | Regulatory and field-safety history | Review recalls, safety notices, corrective actions, complaint trends, and adverse-event reports by product identifier | Complete disclosure with event rate per units sold or implanted, root-cause analysis, and corrective-action status | Raw complaint counts cannot be compared fairly without exposure denominators and reporting-context analysis |
| Mechanical Reliability | Aseptic loosening, wear, osteolysis, and migration | Evaluate radiographic progression, component migration, revision indication, and implant-specific failure modes | Standardized radiographic protocols, blinded assessment where possible, and serial imaging beyond 5 years | Radiographic warning signs may precede revision and should not be ignored in short-term studies |
| Registry Performance | National or regional registry ranking | Prefer registries with broad coverage, validated linkage, transparent methodology, and product-level reporting | Adjusted hazard ratios, confidence intervals, number at risk, and minimum follow-up are available | Registry results are highly valuable but may still be affected by surgeon selection and procedure-mix differences |
| Data Transparency | Conflict-of-interest and data availability | Independent authorship, disclosed funding, accessible protocol, and reproducible definitions strengthen credibility | Results are consistent across manufacturer-sponsored and independent studies | Consistent external replication is more persuasive than a single favorable study |
| Evidence Maturity | Product or design time on the market | Separate established designs with ≥10 years of follow-up from newer designs with limited surveillance time | Evidence covers the exact implant family, materials, fixation method, indications, and current configuration | A successful predecessor does not automatically validate a materially modified design |
| Overall Assessment | Balanced quality score | Use a weighted review: clinical evidence 30%, long-term performance 25%, safety 20%, registry data 15%, transparency 10% | No single metric dominates; missing data are recorded separately from poor outcomes | The strongest choice is usually the option with consistent, independently verified evidence across multiple dimensions |
How to Compare Orthopedic Implant Quality Across Brands in 2026?
Regulatory approval is a threshold, not a trophy. Check the approval route, intended use, and clinical evidence. A 510(k) clearance usually confirms substantial equivalence, not superior clinical performance. Under newer European requirements, manufacturers must also support stronger post-market surveillance. Review the public safety notices, recalls, and complaint trends. These details often reveal weaknesses that marketing language hides.
Tips: Ask for the approval number, instructions for use, clinical follow-up period, and revision data. Confirm whether reported results include all patients or only selected cases. A polished dashboard can hide missing denominators.
Quality control requires more than an ISO 13485 certificate. Examine sterilization validation, supplier controls, batch-release testing, and traceability from production to hospital use. The National Joint Registry’s 21st Annual Report 2024 contains data from more than four million joint procedures. Its long-term revision evidence shows why early approval cannot replace years of surveillance. Compare revision rates by patient age, implant fixation, and follow-up duration. Do not compare percentages blindly. Transparency also means publishing limitations, adverse-event definitions, and incomplete-data rates. No checklist is perfect. I would still document every unanswered question before choosing an implant.
Implant quality is not a simple ranking exercise. Total value includes durability, surgical fit, rehabilitation demands, follow-up access, and revision risk. The American Joint Replacement Registry’s 2024 Annual Report draws on millions of hip and knee procedures, showing why long-term surveillance matters more than marketing claims. Ask for evidence on survivorship, revision rates, and patient-reported outcomes. Short-term price can hide long-term costs.
Surgeon experience also changes the result. A well-designed implant may perform poorly if its instruments, surgical approach, or sizing system do not match the surgeon’s routine. Discuss how often the surgeon uses comparable systems, how complications are managed, and which outcomes are measured locally. Patient-specific needs remain central. Bone quality, activity level, anatomy, allergies, age, and future revision possibilities should shape the decision. The OECD’s Health at a Glance 2023 reports substantial international variation in joint-replacement rates, reminding us that practice patterns are not universal. More data does not always mean better care.
Tips: Bring your imaging and medication list to the consultation. Request plain-language evidence, not only brochures. Compare total costs, including rehabilitation and possible revision care. Ask what happens if the implant does not fit as expected. I would also question my own assumptions: familiar technology may feel safer, but familiarity is not proof of superiority.
Review peer-reviewed trials, joint registries, and independent follow-up studies. Compare similar patients, surgical methods, and follow-up periods. A five-year result cannot fairly compete with ten years. Look for revision surgery, infection, loosening, fractures, pain, mobility, and patient-reported function.
Revision rates show how often implants require additional surgery. Check patient numbers, follow-up duration, age groups, fixation methods, and confidence intervals. A low percentage may look impressive. Missing patients can make durability appear better than it is.
Search public safety notices, adverse-event reports, and recall histories. Separate isolated manufacturing problems from repeated design patterns. Ask how severe the problems were and whether corrective actions worked. A clean record does not mean zero risk.
No. Approval usually confirms acceptable use under specific conditions. It does not automatically prove better long-term performance. Check the approval route, intended use, clinical evidence, and post-market surveillance.
Review sterilization validation, supplier controls, batch-release testing, and product traceability. Ask how each implant is tracked from production to surgery. Lot records matter. An ISO certificate alone is not enough.
Include purchase cost, surgical fit, rehabilitation, follow-up access, and possible revision care. A cheaper implant may create larger long-term costs. Ask for survivorship and patient-reported outcomes, not only short-term prices.
Surgeon experience can change results significantly. Ask how often the surgeon uses similar systems and manages related complications. Instruments, sizing, and surgical technique must suit the surgeon’s routine. Good design is not enough.
Discuss bone quality, anatomy, activity level, allergies, age, and possible future revision needs. Bring imaging and a medication list. Ask what happens if the implant does not fit as expected. I would also question my assumptions. Familiar does not always mean safer.
Comparing orthopedic implant quality across brands requires a structured review of more than price or marketing claims. To understand How to compare the quality of orthopedic implants from different manufacturers, begin by examining the implant’s materials, biocompatibility, design, durability, and manufacturing standards. Important factors include surface treatment, fixation method, wear resistance, dimensional consistency, and whether production follows robust quality-control procedures. These technical characteristics should be evaluated alongside clinical research, documented safety outcomes, revision rates, and evidence of long-term performance in patients with similar needs.
A complete assessment should also consider regulatory approval, traceability, post-market monitoring, and the transparency of the manufacturer’s technical documentation. Total value includes expected service life, surgical instruments, follow-up requirements, and potential revision costs rather than the initial purchase price alone. Finally, surgeon experience with a specific implant system and the patient’s anatomy, activity level, bone quality, allergies, and medical history are essential. The best choice is therefore an evidence-based decision made collaboratively by the patient and qualified orthopedic professional.